


Photo by Jim Wilson on Unsplash
Have you ever wanted to pivot a Spark dataframe to change rows into columns or vice versa? Let me tell you that Spark provides a simple function to do it. In this blog, we will explore what the pivot function does. What’s the difference between pivot and transpose? And how do you use it based on your need to get the most insights from your data?
I’ll use PySpark, but keep in mind that the same function is available in Scala, Java, and the R Spark API.
What is a pivot table?
A pivot table is a data representation of a table used to compute summarized and aggregated data in a tabular format. Pivot tables allow you to rearrange data according to your needs. The process of creating a pivot table involves selecting a set of variables that you want to summarize and then grouping the data by those variables. It involves rotating or transposing rows of data into columns based on certain criteria, such as grouping and aggregating.
Before Apache Spark was created, the pivot operation was already available in traditional SQL databases and implemented through SQL queries. It was typically achieved using aggregate functions and conditional expressions. The specific syntax for pivoting data varied across different database management systems, but the general concept remained the same.
Pivot tables are commonly used in data analysis and business intelligence. They enable you to transform large and complex data sets into simple and easy-to-understand tables that provide valuable insights into your data.
How do I pivot a dataframe in PySpark?
A pivot function is a transformation that runs over a dataframe. For this example, we’ll start by creating a sample dataframe of car sales prices in some US cities.
from pyspark.sql import SparkSession
spark = SparkSession.builder.appName("CarSales").getOrCreate()
data = [
("Toyota", "NewYork", 25000),
("Honda", "SanFrancisco", 22000),
("Ford", "NewYork", 28000),
("Toyota", "NewYork", 26000),
("Honda", "SanFrancisco", 23000),
("Ford", "NewYork", 29000),
("Toyota", "NewYork", 24000),
("Honda", "SanFrancisco", 21000),
("Ford", "SanFrancisco", 27000),
("Toyota", "NewYork", 23000),
("Honda", "SanFrancisco", 22000),
("Ford", "SanFrancisco", 30000)
]
columns = ["Model", "City", "Price"]
df = spark.createDataFrame(data, columns)
As we’ll perform a group by operation, we group data over the desired columns. This will create a GroupedData object that we’ll use to pivot.
Spark offers various aggregation functions that you can apply when pivoting data. Here are some commonly used aggregation functions:
- sum: calculates the sum of values within each pivot cell. Useful for aggregating numeric data like total sales or revenue.
- avg: computes the average of values within each pivot cell. Ideal for getting the mean value of numeric data like average prices.
- count: counts the number of occurrences within each pivot cell. Useful for counting categorical data or occurrences of events.
- max/min: determines the maximum value within each pivot cell. Helpful for finding the highest or lowest value within a category.
- collect_list/collect_set: collects values within each pivot cell into a list or set, respectively. Useful for aggregating and preserving multiple values within a category. Lists can contain duplicate values; sets will contain distinct values.
grouped_data = df.groupBy("Model", "City")
pivoted_data = grouped_data.pivot("City").avg("Price").drop("City")
pivoted_data.show()
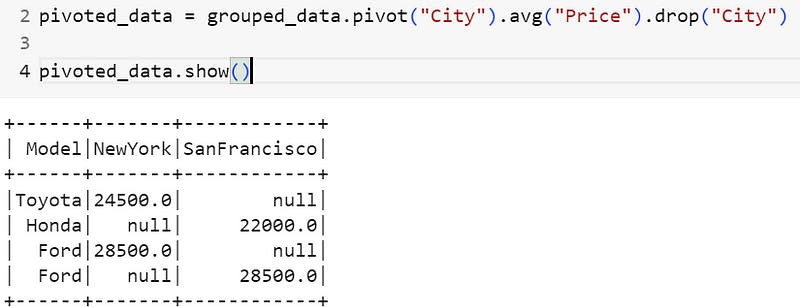
Result of pivoting based on city column
You can see that the city column values are now pivot columns, and the values represent the average price matrix of a model in a city. We can use the model column as a pivot:
pivoted_data = grouped_data.pivot("Model").avg("Price").drop("Model")
pivoted_data.show()
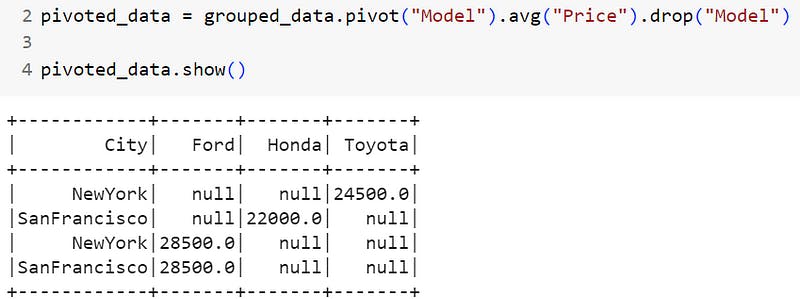
Result of pivoting based on model column
We can use the map format to specify the aggregations.
pivoted_data = grouped_data.pivot("City").avg("Price").drop("City")
result_sum = pivoted_data.agg({"NewYork": "sum", "SanFrancisco": "sum"})
result_sum.show()
result_avg = pivoted_data.agg({"NewYork": "avg", "SanFrancisco": "avg"})
result_avg.show()
result_count = pivoted_data.agg({"NewYork": "count", "SanFrancisco": "count"})
result_count.show()
result_max = pivoted_data.agg({"NewYork": "max", "SanFrancisco": "max"})
result_max.show()
result_min = pivoted_data.agg({"NewYork": "min", "SanFrancisco": "min"})
result_min.show()
# We can also create a different aggregation one for each city
# For instance having the min price at New York city and the max price at San Francisco
result_mix = pivoted_data.agg({"NewYork": "min", "SanFrancisco": "max"})
result_mix.show()
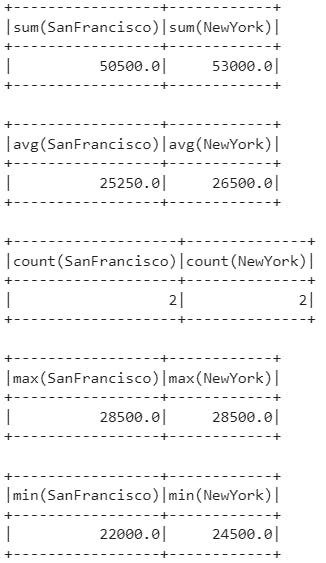
Result of pivoting based on a map of agg functions
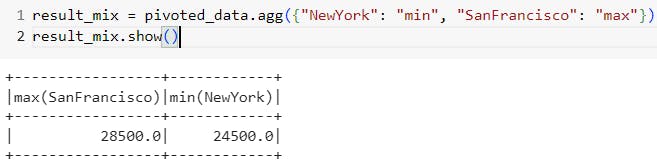
Result of pivoting based on a mix of agg functions
And if you’re interested in pivoting based on a selection of column values, you can pass an array of those values to the pivot function to skip the remaining ones. For instance, we don’t need to get Honda’s data.
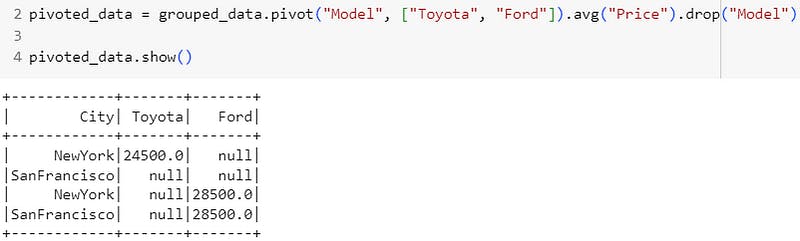
Result of pivoting based on a list of column values
💡 Remark
Pivoting and transposing are two different operations.
- Pivoting involves grouping the data by one or more variables (called pivot variables) and rearranging it so that the values of another variable are displayed in columns.
- Transposing involves flipping the dataframe so that the columns become rows and the rows become columns, with no data grouping or aggregation.
The ability to pivot and create data tables is a key feature of data analysis. Pivot tables, as we have seen, can reorganize and aggregate data by grouping it based on specific criteria, resulting in more digestible and informative tables. Such insights in areas like data analytics and business intelligence are crucial to simplifying complex datasets for better understanding.
Resources
[pyspark.sql.GroupedData.pivot - PySpark 3.2.1 documentation
pyspark.sql.SparkSession.builder.getOrCreatespark.apache.org](https://spark.apache.org/docs/3.2.1/api/python/reference/api/pyspark.sql.GroupedData.pivot.html "spark.apache.org/docs/3.2.1/api/python/refe..")
[Google Colaboratory
Edit descriptioncolab.research.google.com](https://colab.research.google.com/drive/1CF0w_UTyxPrFrclmp5_aymdwvSeT2cUg?usp=sharing "colab.research.google.com/drive/1CF0w_UTyxP..")